




SCADA Monitoring System Eliminates Manual Meter Checking for a Leading Energy and Manufacturing Client, Achieving Real-Time Visibility Across 1,500 Meters on a Single Platform
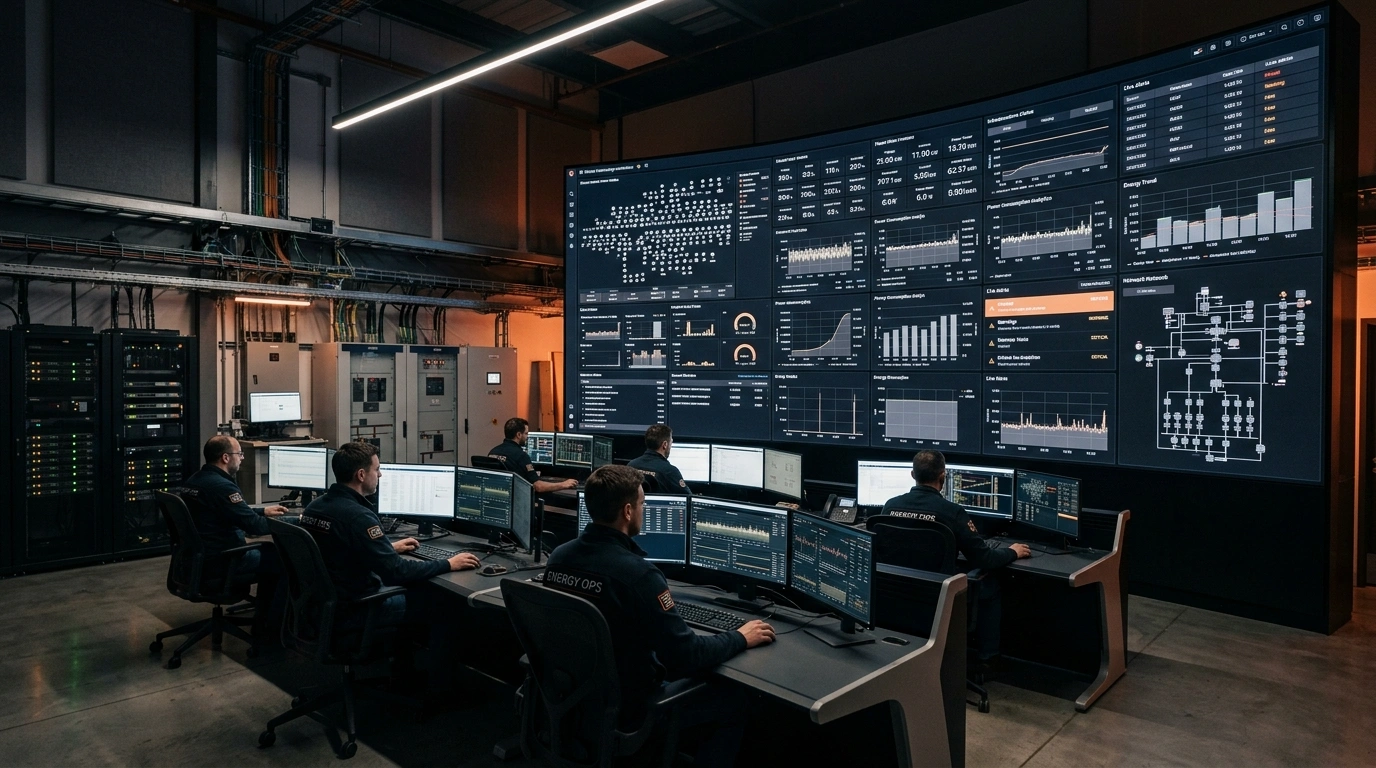
We architected and delivered a comprehensive SCADA-based energy monitoring platform that automatically pulls live data from 1,500 Modbus meters every 30 seconds, replacing hours of daily manual field work with a single, intelligent dashboard.
1,500+
Energy Meters Monitored on One Platform
Every meter across the entire facility unified under a single dashboard.
30s
Real-Time Data Polling Interval
Live readings from every meter refreshed automatically every 30 seconds.
20-25
Parameters Captured Per Meter, Automatically
Every electrical parameter collected and stored with zero manual input.
The Client
About the Client
Our client is a large-scale organization operating across the energy and manufacturing sectors. With an extensive network of 1,500 energy meters spread across their facilities, they are responsible for monitoring and analyzing a vast array of electrical parameters to ensure operational efficiency, energy optimization, and infrastructure reliability. To protect their confidentiality, the client name has not been disclosed in this case study.
The Initial Problem
1,500 Meters, Zero Remote Visibility
The client had no centralized system to monitor their 1,500 Modbus energy meters. Accessing data required a worker to physically walk to each meter, read the values, note them manually, and perform separate data entry. With 1,500 meters and 20 to 25 parameters each, workers were completing this full round every hour — consuming enormous time and manpower while remaining highly vulnerable to human error and missed readings.
The Challenge

Project Objectives
The Solution
Our Suggested Approach
We proposed a purpose-built SCADA monitoring platform designed around the industrial realities of the client’s infrastructure. The solution required both a hardware and software component: Modbus RTU to TCP/IP gateway converters would be installed at each meter to bridge the gap between the legacy Modbus protocol and a modern networked system, while a robust backend service would handle continuous, high-frequency data polling at scale. The platform would then surface all of this data through a feature-rich web interface built for operational teams.
How We Helped
Our engagement began with a full site and infrastructure assessment to understand the physical layout of all 1,500 meters. Once the hardware layer was in place, our backend team built a high-performance data polling service in Node.js capable of continuously querying all meters via Modbus, pulling 20 to 25 electrical parameters per meter every 30 seconds, and persisting that data into a time-series optimized database stack built on PostgreSQL, TimescaleDB, and FlexDB. Our frontend team developed a clean, React-based dashboard giving the client’s team complete real-time visibility from a single screen. The custom screen builder lets users organize meters into logical groups without any technical knowledge. The configurable alarm system notifies personnel via email and SMS when any threshold is exceeded, while the automated alert system detects and flags any meter going offline within seconds — down from up to an hour.
This is custom heading element
Now everything is available on one screen, updated every 30 seconds, with automatic alerts if anything goes wrong. The time savings have been extraordinary, and we finally have the kind of real-time visibility we need to run our operations properly.
— Operations Head, Confidential Client
The Technology Stack
Architecture
SCADA-Based Centralized Monitoring
Frontend
React.js
Backend
Node.js
Database
PostgreSQL, TimescaleDB, FlexDB
Protocol
Modbus RTU over TCP/IP
Notifications
Email and SMS Integration
The Outcome
Key Results
Eliminated Manual Meter Rounds
Workers no longer need to physically visit 1,500 meters every hour. All readings are automatically collected and displayed on the platform every 30 seconds, freeing the team for higher-value work.
Zero Manual Data Entry
The platform pulls and stores all 20 to 25 parameters per meter automatically, removing the burden and error risk of manual data entry entirely.
Real-Time Network Visibility
For the first time, the client has a complete, live overview of all 1,500 meters simultaneously on a single screen, with instant awareness of the status of every device across the facility.
Instant Offline Detection
The automated alert system detects and notifies the team the moment any meter goes offline or becomes unresponsive, reducing the detection window from up to one hour to just seconds.
Proactive Threshold Management
The configurable alarm system ensures the client is immediately notified via email and SMS when any meter exceeds a set parameter threshold, enabling rapid response before issues escalate.
Powerful Historical Analysis
The reports section and historical data graphs give management the tools to analyze energy trends, identify inefficiencies, and make informed decisions across any time period.
Ready to Build Your Own Success Story?
If your operations still depend on manual data collection, field inspections, or disconnected monitoring systems, we can help.
Our team specializes in building custom SCADA and industrial software solutions that deliver real-time visibility and drive measurable efficiency. Let’s talk about your unique challenges.